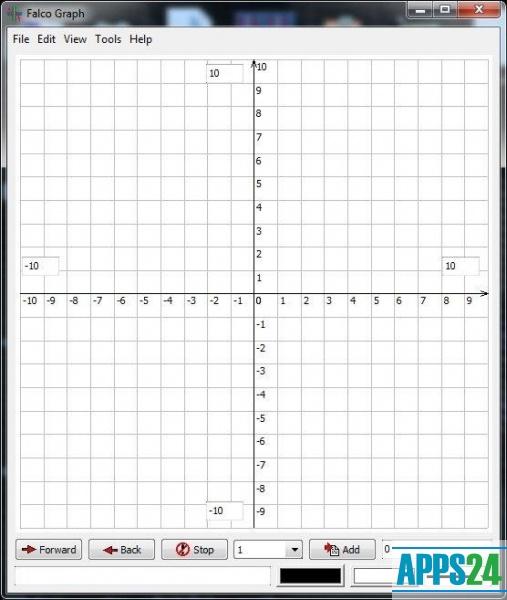
Falco Graph is a graph drawing utility. It makes it easy to draw mathematical and geographical graphs on the X and Y axes.
Working with Falco Graph
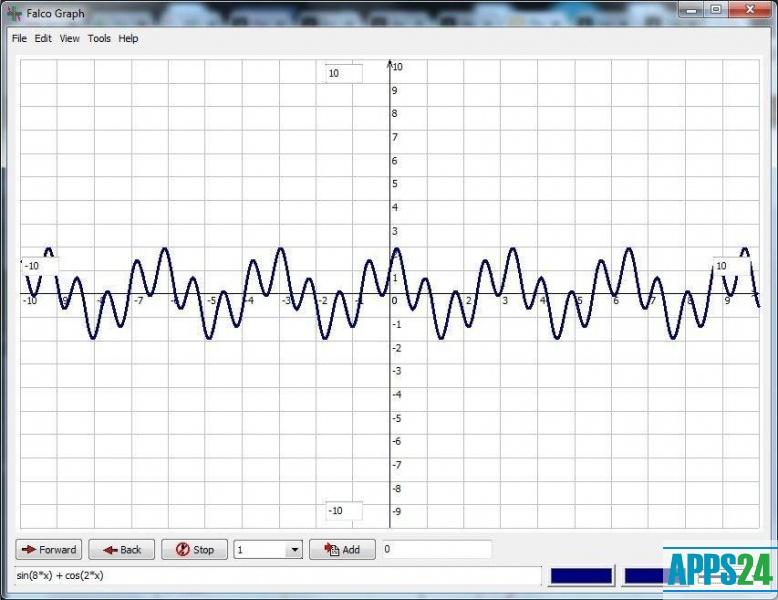
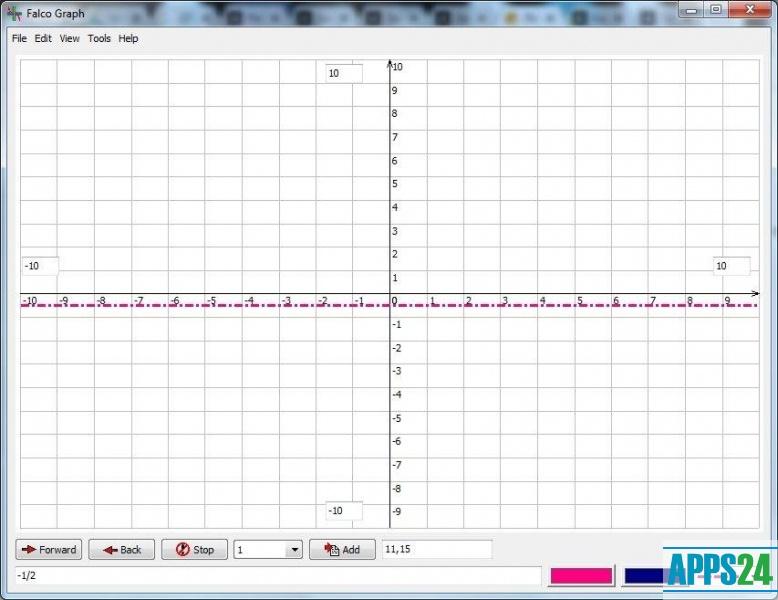
To create a graph in the program, you need to enter the numerical values of its parameters into the command line. The program will display the graph automatically.
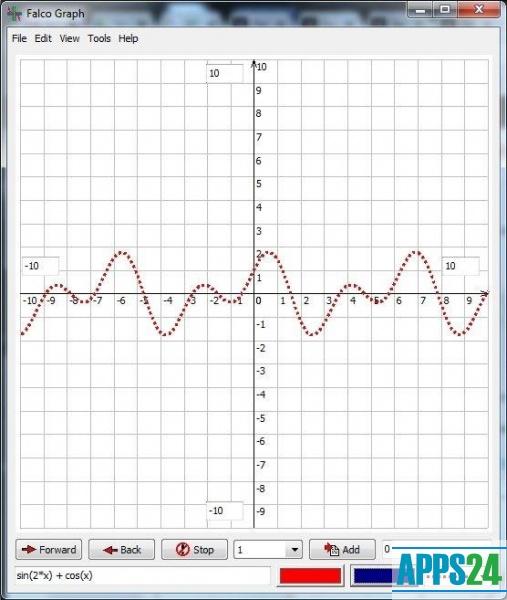
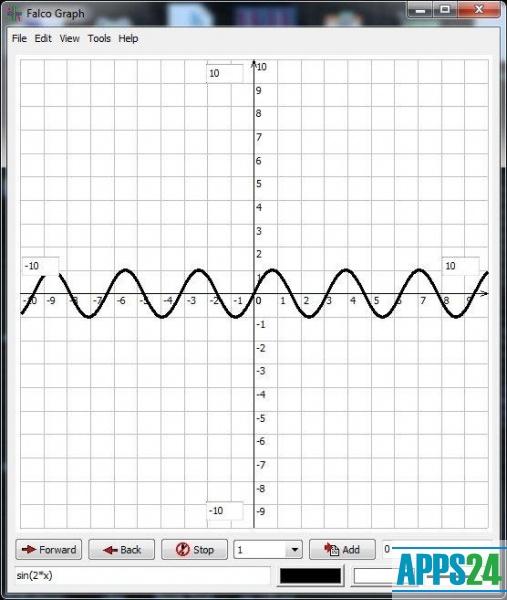
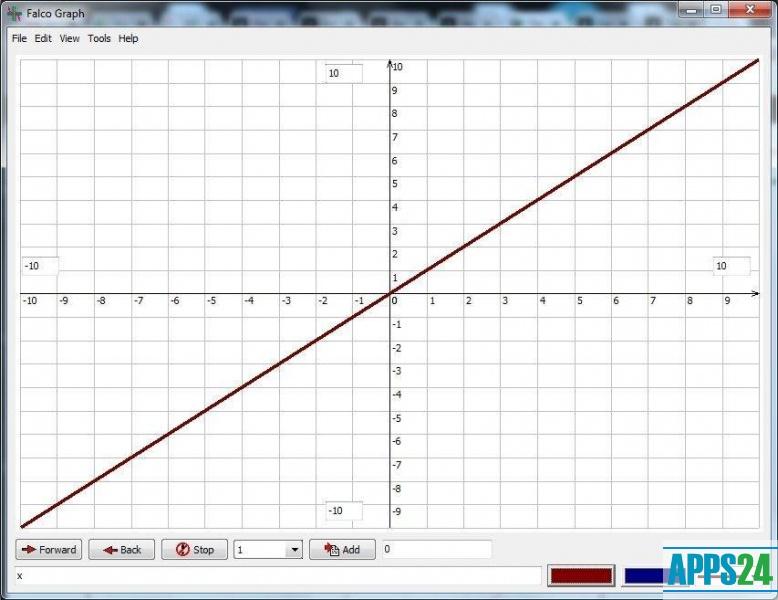
Falco Graph can create graphs by entering the mathematical functions sin, cos, etc. If you want to enter a constant, you have to write the expression "AddConst('Pi', Pi)" into the string. You can also enter complex examples with unknowns.
A program option allows you to fill the graph with color; to do that, you must enter the necessary values into the line, and then select the color of the graph and the color to fill the value space from the color table. It is also possible to change the type of lines by selecting the desired style from the list. Such a graph can be saved to disk.
The program provides for zooming in any part of the graph for a better overview. Any action in the application can be undone using the Undo option or by pressing CTRL+Z. To manipulate the functions in the program, the buttons "Forward", "Back", "Stop" are used.
The main functions of Falco Graph are
- ability to load and record charts;
- graph copying;
- ability to print to a printer;
- drawing of graphs with the T-parameter (in time);
- filling.

Add comment